
Doing a comparison study of different heating methods and all of my results have peaks ar 6AM, 11AM, and 5PM. Is there documentation that I can reference as to why this is?
Question-and-Answer Resource for the Building Energy Modeling Community
| | 1 | initial version |
Doing a comparison study of different heating methods and all of my results have peaks ar 6AM, 11AM, and 5PM. Is there documentation that I can reference as to why this is?
Doing a comparison study of different heating methods and all of my results have heating load peaks ar in DView at 6AM, 11AM, and 5PM. Is there documentation that I can reference as to why this is?
Doing a comparison study of different heating methods and all of my results have heating load peaks in DView data at 6AM, 11AM, 10AM, and 5PM. Is there documentation that I can reference as to why this is?

Doing a comparison study of different heating methods and all of my results have heating load peaks in DView data at 6AM, 10AM, and 5PM. Is there documentation that I can reference as to why this is?
Doing a comparison study of different heating methods and all of my results have heating load peaks in DView data at 6AM, 10AM, and 5PM. Is there documentation that I can reference as to why this is?
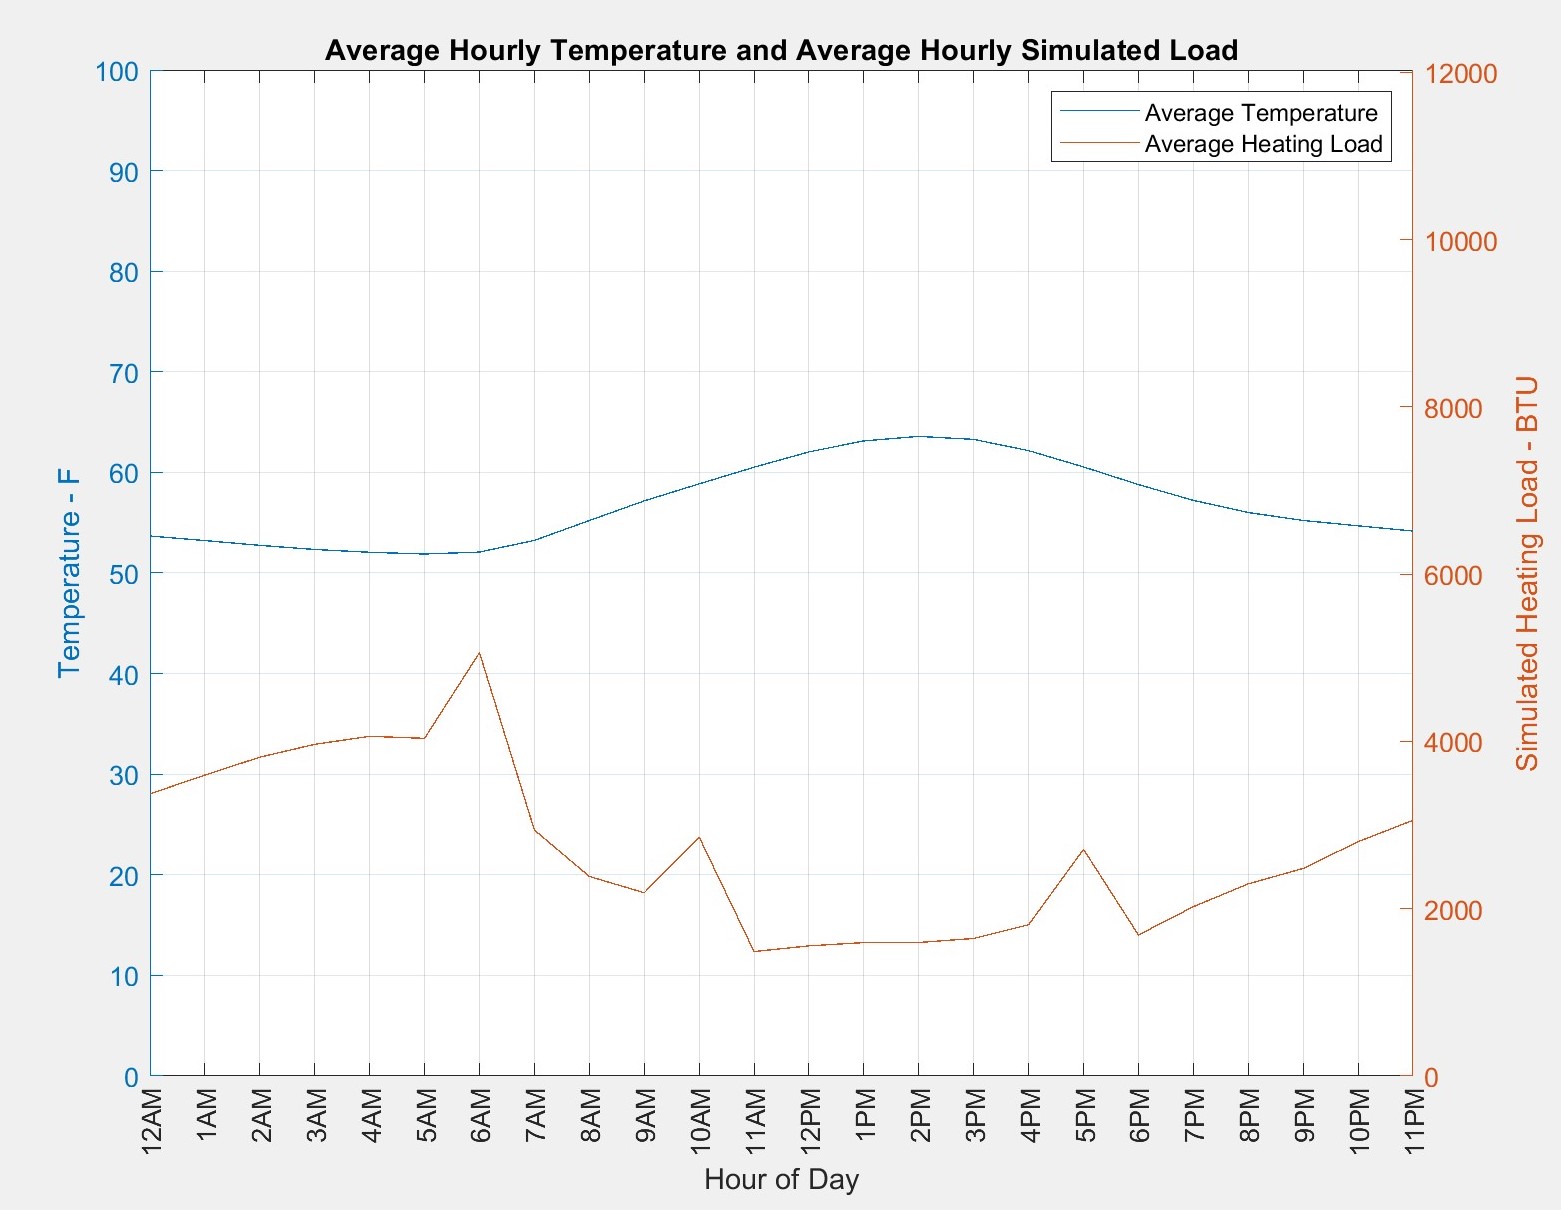
Doing a comparison study of different heating methods at various locations and all of my results have average daily heating load peaks in DView data at 6AM, 10AM, and 5PM. Is there documentation that I can reference as to why this is?
The attached image is a single day, but my averages for daily loads over an entire year always have peaks at these times. Any suggestions as to why BEopt produces this result would be greatly appreciated!
Doing a comparison study of different heating methods at various locations and all of my results have average daily heating load peaks at 6AM, 10AM, and 5PM. Is there documentation that I can reference as to why this is?
The attached image is a single day, but my averages for averaged daily loads over an entire year always have peaks at these times. year. Any suggestions as to why BEopt produces this result would be greatly appreciated!
Doing a comparison study of different heating methods at various locations and all of my results have average daily heating load peaks at 6AM, 10AM, and 5PM. Is there documentation that I can reference as to why this is?
The attached image is averaged daily loads over an entire year. Any suggestions as to why BEopt produces this result would be greatly appreciated!
Here is a GIF of each date over an entire year. As you can see, there aren't always peaks at those times, but it happens often.
| | 11 | retagged |
Doing a comparison study of different heating methods at various locations and all of my results have average daily heating load peaks at 6AM, 10AM, and 5PM. Is there documentation that I can reference as to why this is?
The attached image is averaged daily loads over an entire year. Any suggestions as to why BEopt produces this result would be greatly appreciated!
Here is a GIF of each date over an entire year. As you can see, there aren't always peaks at those times, but it happens often.
| | 12 | retagged |
Doing a comparison study of different heating methods at various locations and all of my results have average daily heating load peaks at 6AM, 10AM, and 5PM. Is there documentation that I can reference as to why this is?
The attached image is averaged daily loads over an entire year. Any suggestions as to why BEopt produces this result would be greatly appreciated!
Here is a GIF of each date over an entire year. As you can see, there aren't always peaks at those times, but it happens often.
Doing a comparison study of different heating methods at various locations and all of my results have average daily heating load peaks at 6AM, 10AM, and 5PM. Is there documentation that I can reference as to why this is?
The attached image is averaged daily loads over an entire year. Any suggestions as to why BEopt produces this result would be greatly appreciated!
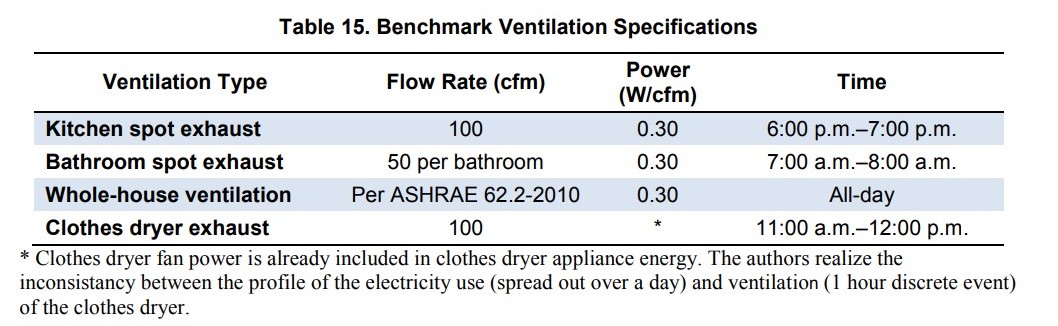
Here EDIT: Also attached is a GIF Table 15 from the Building America House Simulation Protocols, which displays ventilation events that have been suggested as the causes for these peaks. Unfortunately, these times do not correspond with the peaks that occur from averaging each hour of each date over an entire year. As you can see, there aren't always peaks at those times, but it happens often.the DView's Mains Heating Load (as seen in the first image).
Doing a comparison study of different heating methods at various locations and all of my results have average daily heating load peaks at 6AM, 10AM, and 5PM. Is there documentation 5PM.
It should also be mentioned that I can reference my data are translated half an hour prior, as to why this is?DView exports on every half hour. Therefore, in DView, these results would be at 630AM, 1030AM, and 530PM.
The attached image is averaged daily loads over an entire year. Is there documentation that I can reference as to why this is? Any suggestions as to why BEopt produces this result would be greatly appreciated!
EDIT: Also attached is Table 15 from the Building America House Simulation Protocols, which displays ventilation events that have been suggested as the causes for these peaks. Unfortunately, these times do not correspond with the peaks that occur from averaging each hour of the DView's Mains Heating Load (as seen in the first image).


